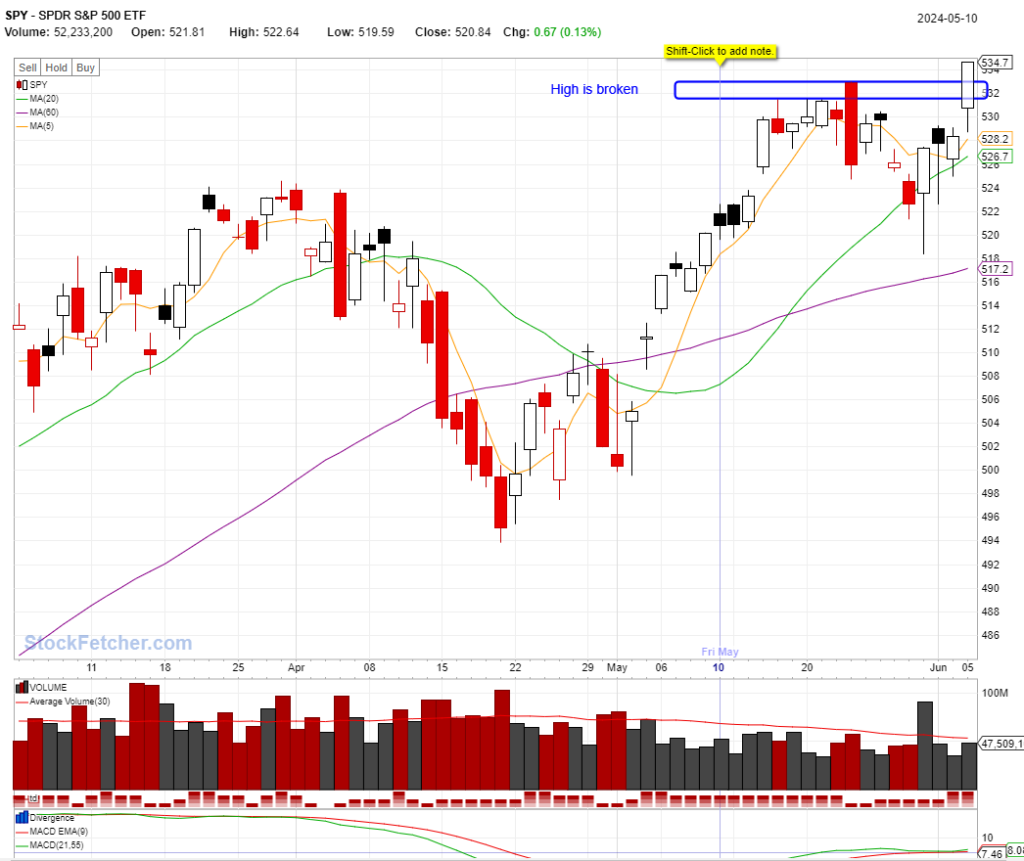
Market Overview
Stocks close sharply higher: Stock markets closed sharply higher on Wednesday, as mega-cap technology led the gains, and artificial intelligence (AI) leader NVIDIA approached $3 trillion in market capitalization. In addition, softening labor market data, combined with better inflation trends more recently, support the notion that the Fed may cut rates in the months ahead. Markets are now pricing in two Fed rate cuts this year, in September and December, according to the CME FedWatch tool. On Wednesday morning, the Bank of Canada (BoC) also initiated its first rate cut of the cycle, lowering rates by 0.25%, from 5.0% to 4.75%, moving ahead of the Federal Reserve. Canadian bond yields fell sharply, with the 2-year Canadian government bond yield down by 0.12% to 3.93%. Meanwhile, U.S. Treasury yields also continue to soften, with the U.S. 2-year Treasury yield also down by 0.04% to 4.73%. The move lower in government bond yields has supported the sentiment in both bond markets and stock markets in recent weeks.
The following are good stocks and best stocks to buy now.
Market Indexes and Winners

Good Stock Set Ups
STOCK SETUP: MSFT @06/05/2024
| Ticker | MSFT, Microsoft Corporation | Note |
| Last Price | 424.01 | |
| Buy | 424.01 | Limit Order This is generated by our mechanical trading system. Please read the chart section for more detailed and flexible entry options. |
| Target | 466.41 | Default at 10%, Or Sell when close below ma5(short term)/10(midterm)/20(long term) or when big down day or when formed inverted hammer at a resistance level |
| Stop | 407.75 | |
| Reward/Risk | 2.61 : 1 |
Above is the summary of one of our Stocks Buy Setup.
More Technical Status for MSFT @06/05/2024
| ATR (14) | 7.65 | Stop can be set at 1xATR below recent low |
| Beta | 0.89 | Beta measure of a stock’s volatility in relation to SP500. Greater than 1.0 means more risky than SP500 |
| RSI(14) | 55.41 | Greater than 50 means bullish. Crossing above 30 in correction is a good buydip too |
| SMA20 | 0.93% | Distance to SMA20 |
| SMA50 | 1.96% | Distance to SMA50 |
| Recommendation | 1.25 | Analysts’ mean recommendation (1=Buy 5=Sell) |
Our system generated several buy signals today. MSFT is one of them. Let’s take a look at this stock’s chart (The first chart below is a live chart).
STOCK SETUP: GS @06/05/2024
| Ticker | GS, Goldman Sachs Group, Inc. | Note |
| Last Price | 461.68 | |
| Buy | 461.68 | Limit Order This is generated by our mechanical trading system. Please read the chart section for more detailed and flexible entry options. |
| Target | 507.85 | Default at 10%, Or Sell when close below ma5(short term)/10(midterm)/20(long term) or when big down day or when formed inverted hammer at a resistance level |
| Stop | 446.19 | |
| Reward/Risk | 2.98 : 1 |
Above is the summary of one of our Stocks Buy Setup.
More Technical Status for GS @06/05/2024
| ATR (14) | 7.79 | Stop can be set at 1xATR below recent low |
| Beta | 1.37 | Beta measure of a stock’s volatility in relation to SP500. Greater than 1.0 means more risky than SP500 |
| RSI(14) | 60.99 | Greater than 50 means bullish. Crossing above 30 in correction is a good buydip too |
| SMA20 | 0.80% | Distance to SMA20 |
| SMA50 | 6.94% | Distance to SMA50 |
| Recommendation | 1.77 | Analysts’ mean recommendation (1=Buy 5=Sell) |
Our system generated several buy signals today. GS is one of them. Let’s take a look at this stock’s chart (The first chart below is a live chart).
STOCK SETUP: XBI @06/05/2024
| Ticker | XBI, SPDR Biotech ETF | Note |
| Last Price | 94.12 | |
| Buy | 94.12 | Limit Order This is generated by our mechanical trading system. Please read the chart section for more detailed and flexible entry options. |
| Target | 103.53 | Default at 10%, Or Sell when close below ma5(short term)/10(midterm)/20(long term) or when big down day or when formed inverted hammer at a resistance level |
| Stop | 89.35 | |
| Reward/Risk | 1.97 : 1 |
Above is the summary of one of our Stocks Buy Setup.
More Technical Status for XBI @06/05/2024
| ATR (14) | 2.38 | Stop can be set at 1xATR below recent low |
| Beta | 0.94 | Beta measure of a stock’s volatility in relation to SP500. Greater than 1.0 means more risky than SP500 |
| RSI(14) | 62.79 | Greater than 50 means bullish. Crossing above 30 in correction is a good buydip too |
| SMA20 | 4.28% | Distance to SMA20 |
| SMA50 | 5.65% | Distance to SMA50 |
| Recommendation | Analysts’ mean recommendation (1=Buy 5=Sell) |
Our system generated several buy signals today. XBI is one of them. Let’s take a look at this stock’s chart (The first chart below is a live chart).
LABU is the 3x of XBI, if you like higher reward and risk, you can go with this one.
