Market Overview
Stocks tread water after Wednesday’s rally: Major equity indexes finished little changed on Thursday following Wednesday’s surge that sent the S&P 500 and Nasdaq to record highs. The fuel for the latest run to new highs has come from familiar sources: enthusiasm over AI alongside optimism for Fed rate cuts amid recent data showing the economy is softening a bit. With no major headline surprises or data to drive the action, markets today appeared content to take a breather, given the S&P 500 has gained more than 3% since the midday lows just five days ago. Nevertheless, we suspect the focus on big tech and the Fed’s reaction to signs of moderating economic growth to remain behind the wheel for equities as we head through the summer. Looking across the board, the consumer and energy sectors were the best performers, gold and oil prices closed higher, and bonds were essentially flat on the day.*
Market Indexes and Winners
Good Stock Set Ups
STOCK SETUP: SSYS @06/06/2024
| Ticker | SSYS, Stratasys Ltd | Note |
| Last Price | 9.67 | |
| Buy | 9.67 | Limit Order This is generated by our mechanical trading system. Please read the chart section for more detailed and flexible entry options. |
| Target | 10.64 | Default at 10%, Or Sell when close below ma5(short term)/10(midterm)/20(long term) or when big down day or when formed inverted hammer at a resistance level |
| Stop | 8.79 | |
| Reward/Risk | 1.1 : 1 |
Above is the summary of one of our Stocks Buy Setup.
More Technical Status for SSYS @06/06/2024
| ATR (14) | 0.41 | Stop can be set at 1xATR below recent low |
| Beta | 1.23 | Beta measure of a stock’s volatility in relation to SP500. Greater than 1.0 means more risky than SP500 |
| RSI(14) | 55.36 | Greater than 50 means bullish. Crossing above 30 in correction is a good buydip too |
| SMA20 | 4.71% | Distance to SMA20 |
| SMA50 | -2.43% | Distance to SMA50 |
| Recommendation | 1.71 | Analysts’ mean recommendation (1=Buy 5=Sell) |
Our system generated several buy signals today. SSYS is one of them. Let’s take a look at this stock’s chart (The first chart below is a live chart).
This is a bottom fishing type of play. It provides overall low risk. You can set the stop loss right below the recent low. If it does reverse, it could go all the way to $12.
STOCK SETUP: ZTS @06/06/2024
| Ticker | ZTS, Zoetis Inc | Note |
| Last Price | 176.78 | |
| Buy | 176.78 | Limit Order This is generated by our mechanical trading system. Please read the chart section for more detailed and flexible entry options. |
| Target | 194.46 | Default at 10%, Or Sell when close below ma5(short term)/10(midterm)/20(long term) or when big down day or when formed inverted hammer at a resistance level |
| Stop | 172.3 | |
| Reward/Risk | 3.95 : 1 |
Above is the summary of one of our Stocks Buy Setup.
More Technical Status for ZTS @06/06/2024
| ATR (14) | 3.90 | Stop can be set at 1xATR below recent low |
| Beta | 0.86 | Beta measure of a stock’s volatility in relation to SP500. Greater than 1.0 means more risky than SP500 |
| RSI(14) | 66.08 | Greater than 50 means bullish. Crossing above 30 in correction is a good buydip too |
| SMA20 | 3.34% | Distance to SMA20 |
| SMA50 | 7.56% | Distance to SMA50 |
| Recommendation | 1.18 | Analysts’ mean recommendation (1=Buy 5=Sell) |
Our system generated several buy signals today. ZTS is one of them. Let’s take a look at this stock’s chart (The first chart below is a live chart).
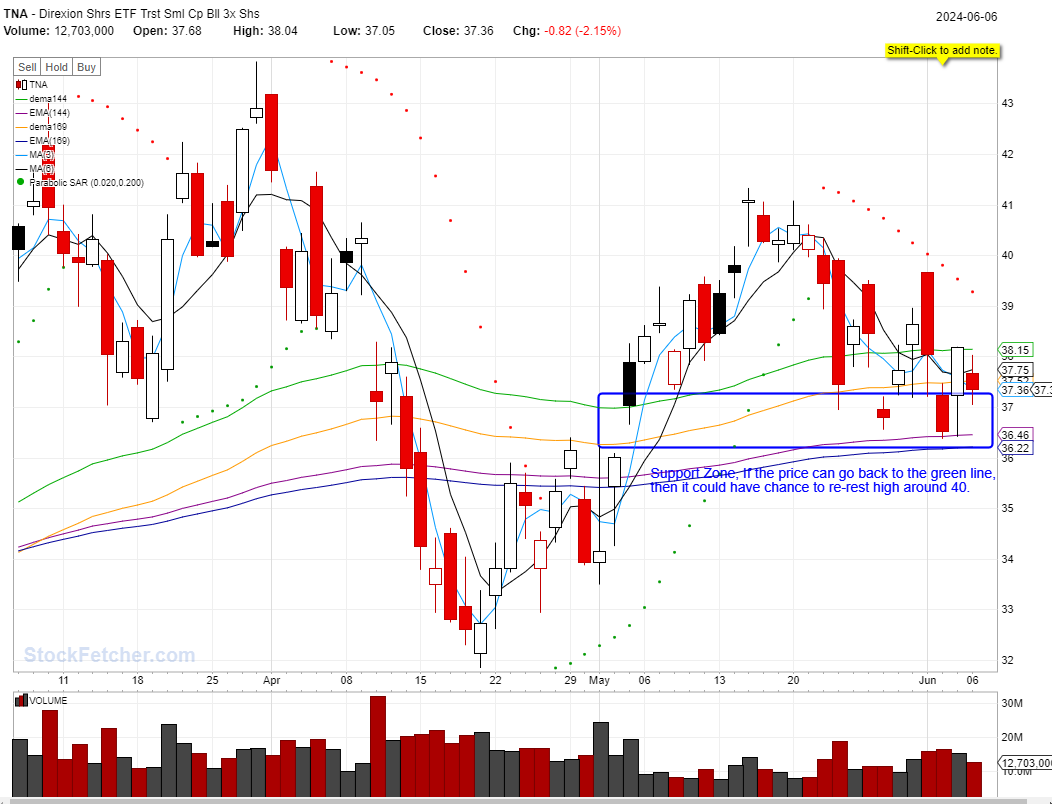
STOCK SETUP: TNA @06/06/2024
| Ticker | TNA, Direxion Daily Small Cap Bull 3X Shares | Note |
| Last Price | 37.36 | |
| Buy | 37.36 | Limit Order This is generated by our mechanical trading system. Please read the chart section for more detailed and flexible entry options. |
| Target | 41.1 | Default at 10%, Or Sell when close below ma5(short term)/10(midterm)/20(long term) or when big down day or when formed inverted hammer at a resistance level |
| Stop | 36.61 | |
| Reward/Risk | 5 : 1 |
Above is the summary of one of our Stocks Buy Setup.
More Technical Status for TNA @06/06/2024
| ATR (14) | 1.64 | Stop can be set at 1xATR below recent low |
| Beta | 3.44 | Beta measure of a stock’s volatility in relation to SP500. Greater than 1.0 means more risky than SP500 |
| RSI(14) | 47.39 | Greater than 50 means bullish. Crossing above 30 in correction is a good buydip too |
| SMA20 | -3.74% | Distance to SMA20 |
| SMA50 | -0.98% | Distance to SMA50 |
| Recommendation | Analysts’ mean recommendation (1=Buy 5=Sell) |
Our system generated several buy signals today. TNA is one of them. Let’s take a look at this stock’s chart (The first chart below is a live chart).
TNA is small cap. Because SPY and QQQ are all on all time high. And we don’t want to chase high. Instead we can potentially find something is fairly cheap and ready to work with. TNA could be the next one to pop. But again, remember, this is a 3X ETF, run if it go against you.
