Market Overview
Stocks start the week modestly higher – U.S. stock-market indexes closed higher on Monday, as investors await the CPI inflation report for May and the interest-rate decision from the June Federal Reserve meeting, both of which will come on Wednesday. The tech-heavy Nasdaq outpaced the S&P 500 and Dow Jones indexes. Treasury bond yields also continued to climb modestly, with the 10-year Treasury yield up 0.03% to 4.46%, well above its recent lows of 4.27%. European stocks fell on Monday, as uncertainty around European Parliament elections weighed on market sentiment. Meanwhile, oil prices stabilized, with WTI crude oil up over 3% after falling for the past three weeks.
Market Indexes and Winners
Good Stock Set Ups
STOCK SETUP: ERJ @06/10/2024
| Ticker | ERJ, Embraer S.A. ADR | Note |
| Last Price | 29.15 | |
| Buy | 29.15 | Limit Order This is generated by our mechanical trading system. Please read the chart section for more detailed and flexible entry options. |
| Target | 32.07 | Default at 10%, Or Sell when close below ma5(short term)/10(midterm)/20(long term) or when big down day or when formed inverted hammer at a resistance level |
| Stop | 28.27 | |
| Reward/Risk | 3.32 : 1 |
Above is the summary of one of our Stocks Buy Setup.
More Technical Status for ERJ @06/10/2024
| ATR (14) | 1.01 | Stop can be set at 1xATR below recent low |
| Beta | 1.73 | Beta measure of a stock’s volatility in relation to SP500. Greater than 1.0 means more risky than SP500 |
| RSI(14) | 58.31 | Greater than 50 means bullish. Crossing above 30 in correction is a good buydip too |
| SMA20 | 1.14% | Distance to SMA20 |
| SMA50 | 8.63% | Distance to SMA50 |
| Recommendation | 1.47 | Analysts’ mean recommendation (1=Buy 5=Sell) |
Our system generated several buy signals today. ERJ is one of them. Let’s take a look at this stock’s chart (The first chart below is a live chart).
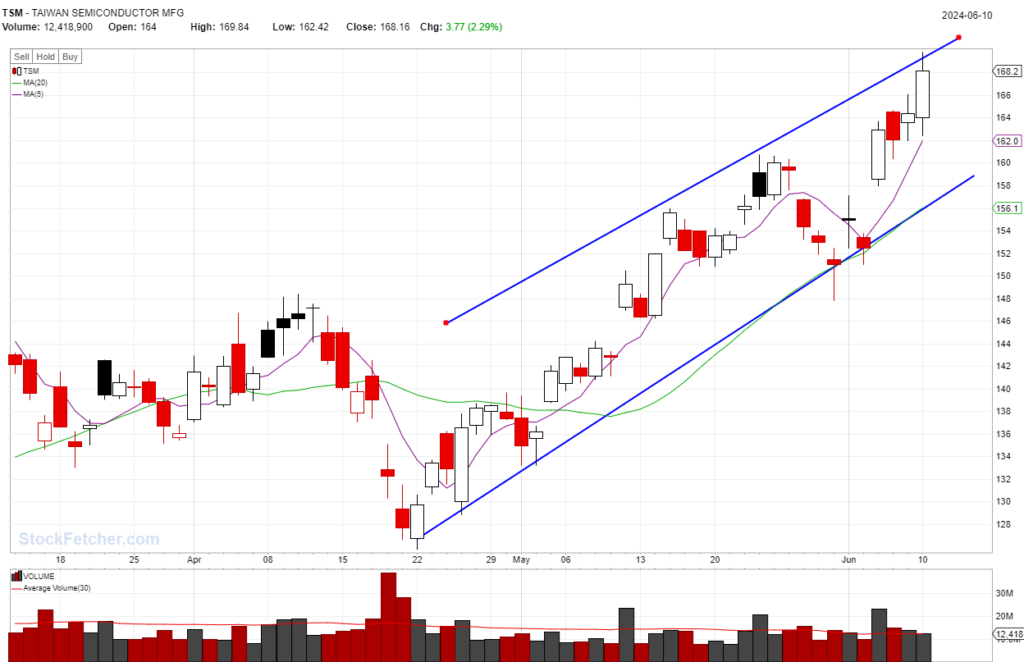
STOCK SETUP: TSM @06/10/2024
| Ticker | TSM, Taiwan Semiconductor Manufacturing ADR | Note |
| Last Price | 168.16 | |
| Buy | 168.16 | Limit Order This is generated by our mechanical trading system. Please read the chart section for more detailed and flexible entry options. |
| Target | 184.98 | Default at 10%, Or Sell when close below ma5(short term)/10(midterm)/20(long term) or when big down day or when formed inverted hammer at a resistance level |
| Stop | 161.1 | |
| Reward/Risk | 2.38 : 1 |
Above is the summary of one of our Stocks Buy Setup.
More Technical Status for TSM @06/10/2024
| ATR (14) | 4.86 | Stop can be set at 1xATR below recent low |
| Beta | 1.13 | Beta measure of a stock’s volatility in relation to SP500. Greater than 1.0 means more risky than SP500 |
| RSI(14) | 69.46 | Greater than 50 means bullish. Crossing above 30 in correction is a good buydip too |
| SMA20 | 8.42% | Distance to SMA20 |
| SMA50 | 15.56% | Distance to SMA50 |
| Recommendation | 1.37 | Analysts’ mean recommendation (1=Buy 5=Sell) |
Our system generated several buy signals today. TSM is one of them. Let’s take a look at this stock’s chart (The first chart below is a live chart).
This is break out play. While AI is so hot, TSM is safe bet.