Market Overview
Stocks tick higher ahead of tomorrow’s inflation report: Stocks logged modest gains on Thursday, with the S&P 500 rising by 0.1% while the Nasdaq logged a 0.3% gain.* The consumer discretionary and real estate sectors of the S&P 500 were today’s top performers, while the defensive consumer staples sector lagged.* On the economic front, initial jobless claims came in slightly lower than consensus expectations, while headline durable goods orders rose by 0.1% in May, above expectations for no change
Market Indexes and Winners
Good Stock Set Ups
STOCK SETUP: TLT @06/27/2024
| Ticker | TLT, iShares 20+ Year Treasury Bond ETF | Note |
| Last Price | 93.52 | |
| Buy | 93.52 | Limit Order This is generated by our mechanical trading system. Please read the chart section for more detailed and flexible entry options. |
| Target | 102.87 | Default at 10%, Or Sell when close below ma5(short term)/10(midterm)/20(long term) or when big down day or when formed inverted hammer at a resistance level |
| Stop | 91.29 | |
| Reward/Risk | 4.19 : 1 |
Above is the summary of one of our Stocks Buy Setup.
More Technical Status for TLT @06/27/2024
| ATR (14) | 0.98 | Stop can be set at 1xATR below recent low |
| Beta | 0.25 | Beta measure of a stock’s volatility in relation to SP500. Greater than 1.0 means more risky than SP500 |
| RSI(14) | 54.66 | Greater than 50 means bullish. Crossing above 30 in correction is a good buydip too |
| SMA20 | 0.91% | Distance to SMA20 |
| SMA50 | 2.73% | Distance to SMA50 |
| Recommendation | #RECOM# | Analysts’ mean recommendation (1=Buy 5=Sell) |
Our system generated several buy signals today. TLT is one of them. Let’s take a look at this stock’s chart (The first chart below is a live chart). From the chart below, we can see, it breaks the downtrend line. If that hold, it should head to 96 and 98 range soon.
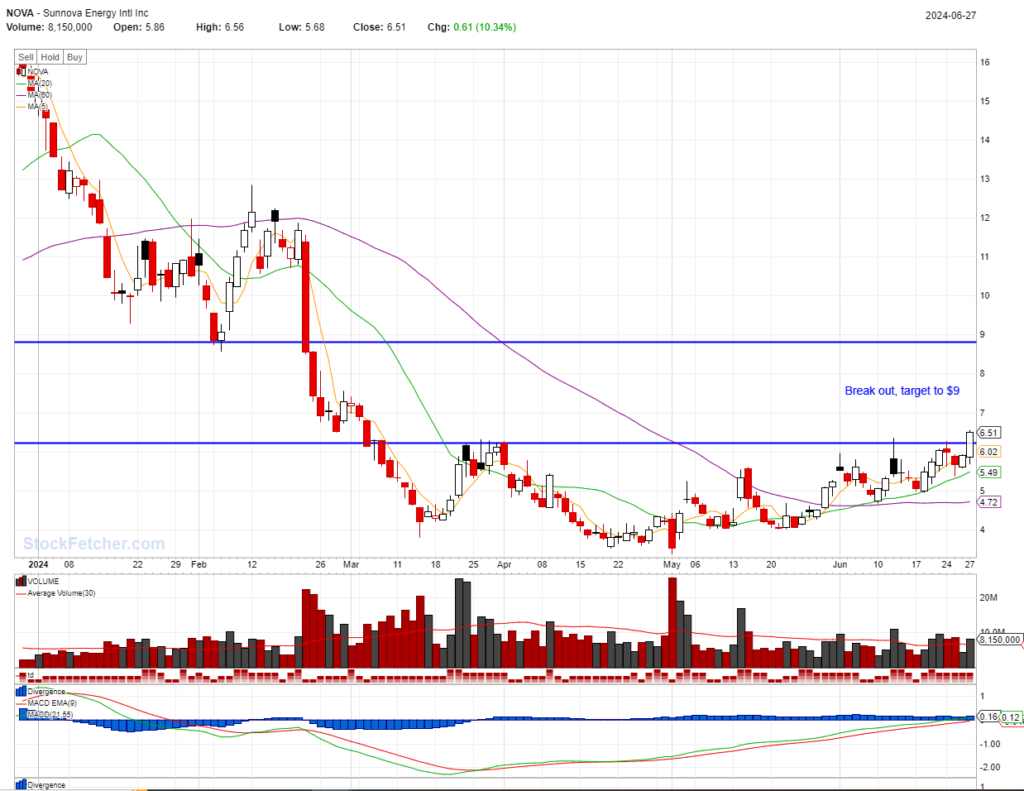
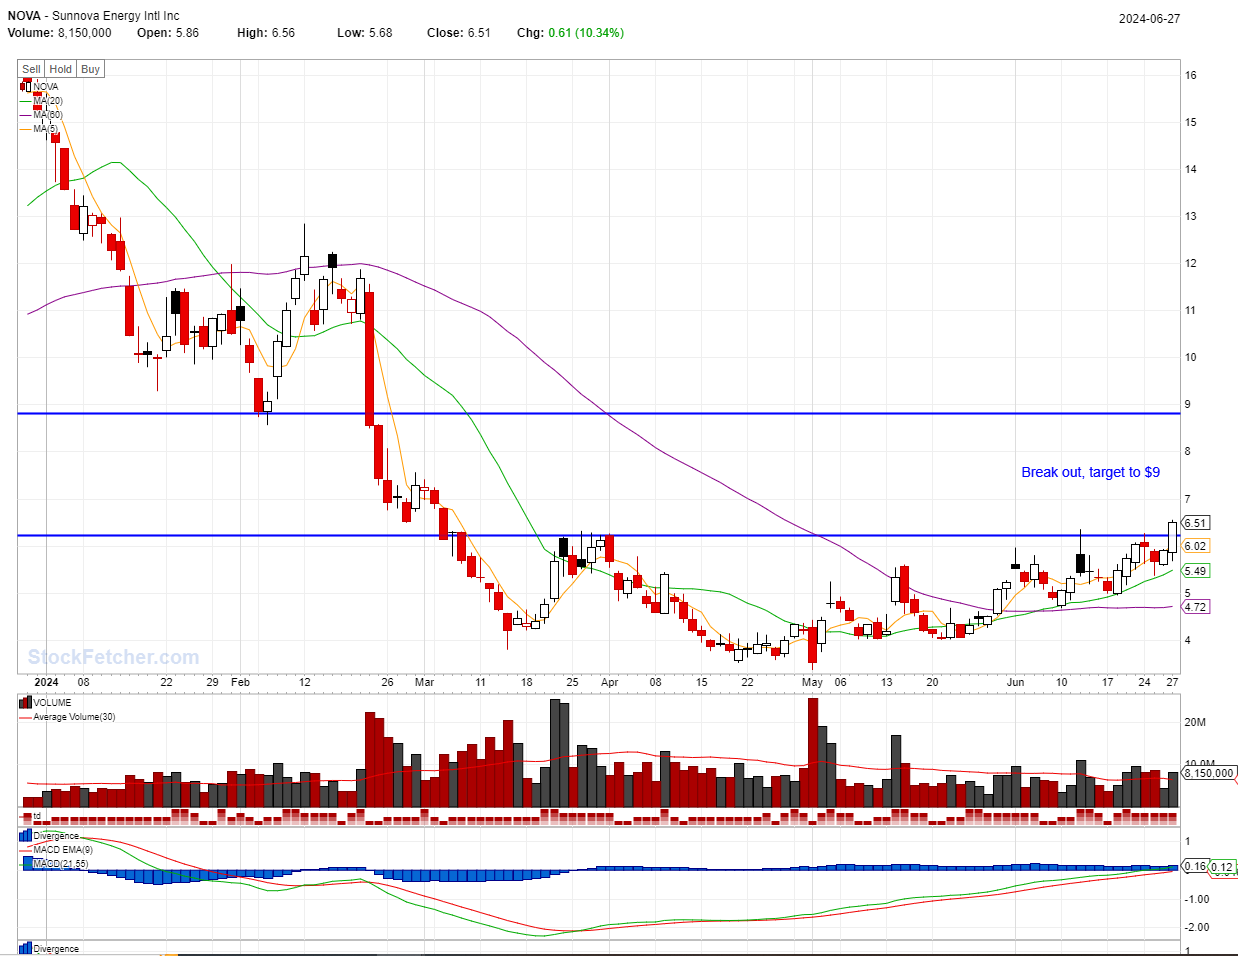
STOCK SETUP: NOVA @06/27/2024
| Ticker | NOVA, Sunnova Energy International Inc | Note |
| Last Price | 6.51 | |
| Buy | 6.51 | Limit Order This is generated by our mechanical trading system. Please read the chart section for more detailed and flexible entry options. |
| Target | 7.16 | Default at 10%, Or Sell when close below ma5(short term)/10(midterm)/20(long term) or when big down day or when formed inverted hammer at a resistance level |
| Stop | 5.78 | |
| Reward/Risk | .89 : 1 |
Above is the summary of one of our Stocks Buy Setup.
More Technical Status for NOVA @06/27/2024
| ATR (14) | 0.56 | Stop can be set at 1xATR below recent low |
| Beta | 2.19 | Beta measure of a stock’s volatility in relation to SP500. Greater than 1.0 means more risky than SP500 |
| RSI(14) | 65.83 | Greater than 50 means bullish. Crossing above 30 in correction is a good buydip too |
| SMA20 | 20.78% | Distance to SMA20 |
| SMA50 | 39.17% | Distance to SMA50 |
| Recommendation | 1.75 | Analysts’ mean recommendation (1=Buy 5=Sell) |
Our system generated several buy signals today. NOVA is one of them. Let’s take a look at this stock’s chart (The first chart below is a live chart). NOVA appears is making a nice round bottom. We might be able to see it is heading to $8 very soon.