Market Overview
Stocks close lower – Major equity indexes closed modestly lower on Friday but remained up for the week. Small- and mid-cap stocks trailed large-cap stocks for the day. Sectors were mixed, with utilities and materials leading to the downside, and financials, technology and health care higher. In global markets, Asia was mixed on lower-than-expected consumer spending in Japan and exports from China that topped estimates. Europe was lower, as investors evaluated first-quarter GDP showing seasonally adjusted growth of 0.3% over the prior quarter, as expected. The U.S. dollar was higher versus major currencies, with the European Central Bank and Bank of Canada cutting rates earlier in the week. In the commodity space, WTI oil was down on OPEC+ production hikes. Gold is also lower on a pause in purchases by China’s central bank.
Market Indexes and Winners
Board market paused at high and most likely will move lower or sideway to digest recent gain.
Good Stock Set Ups
STOCK SETUP: PINS @06/07/2024
| Ticker | PINS, Pinterest Inc | Note |
| Last Price | 44.11 | |
| Buy | 44.11 | Limit Order This is generated by our mechanical trading system. Please read the chart section for more detailed and flexible entry options. |
| Target | 48.52 | Default at 10%, Or Sell when close below ma5(short term)/10(midterm)/20(long term) or when big down day or when formed inverted hammer at a resistance level |
| Stop | 41.88 | |
| Reward/Risk | 1.97 : 1 |
Above is the summary of one of our Stocks Buy Setup.
More Technical Status for PINS @06/07/2024
| ATR (14) | 1.09 | Stop can be set at 1xATR below recent low |
| Beta | 0.96 | Beta measure of a stock’s volatility in relation to SP500. Greater than 1.0 means more risky than SP500 |
| RSI(14) | 71.48 | Greater than 50 means bullish. Crossing above 30 in correction is a good buydip too |
| SMA20 | 5.39% | Distance to SMA20 |
| SMA50 | 16.44% | Distance to SMA50 |
| Recommendation | 1.71 | Analysts’ mean recommendation (1=Buy 5=Sell) |
Our system generated several buy signals today. PINS is one of them. Let’s take a look at this stock’s chart (The first chart below is a live chart).
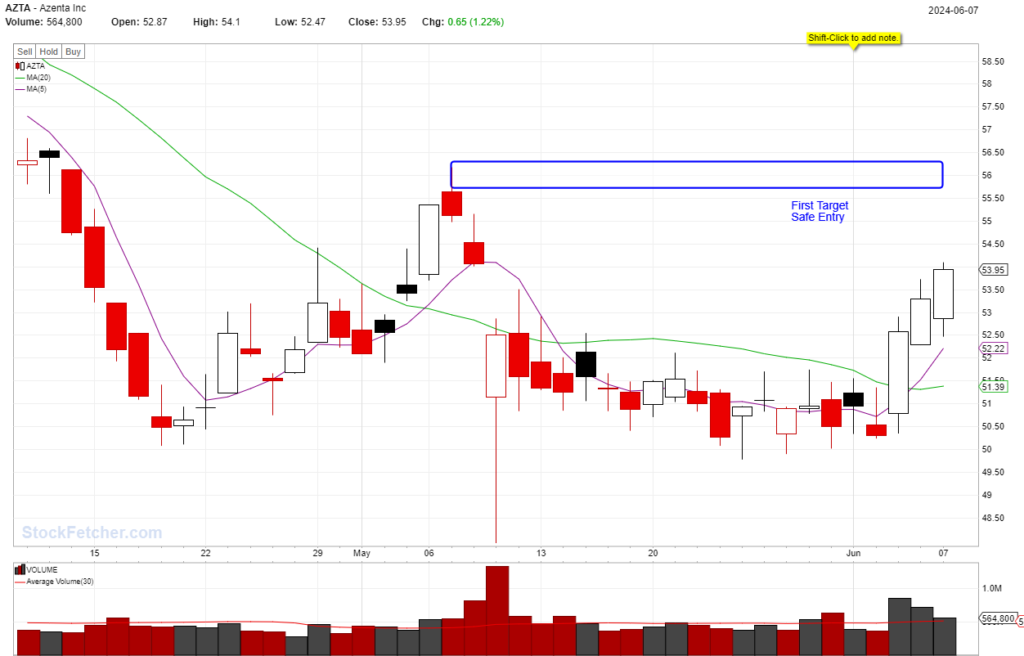
STOCK SETUP: AZTA @06/07/2024
| Ticker | AZTA, Azenta Inc | Note |
| Last Price | 53.95 | |
| Buy | 53.95 | Limit Order This is generated by our mechanical trading system. Please read the chart section for more detailed and flexible entry options. |
| Target | 59.35 | Default at 10%, Or Sell when close below ma5(short term)/10(midterm)/20(long term) or when big down day or when formed inverted hammer at a resistance level |
| Stop | 52.23 | |
| Reward/Risk | 3.14 : 1 |
Above is the summary of one of our Stocks Buy Setup.
More Technical Status for AZTA @06/07/2024
| ATR (14) | 1.46 | Stop can be set at 1xATR below recent low |
| Beta | 1.52 | Beta measure of a stock’s volatility in relation to SP500. Greater than 1.0 means more risky than SP500 |
| RSI(14) | 59.99 | Greater than 50 means bullish. Crossing above 30 in correction is a good buydip too |
| SMA20 | 5.13% | Distance to SMA20 |
| SMA50 | 1.18% | Distance to SMA50 |
| Recommendation | 2.67 | Analysts’ mean recommendation (1=Buy 5=Sell) |
Our system generated several buy signals today. AZTA is one of them. Let’s take a look at this stock’s chart (The first chart below is a live chart).