Market Overview

As if the recent trading volume wasn’t low enough, now we kick off the trading week on Tuesday due to the Memorial Day holiday on Monday.
Stocks are tip-toeing into the week after the S&P 500 ended about flat last week and as investors focus on the remaining trading sessions in May.
The big focus this week will be the revised GDP report on Thursday and the PCE report on Friday. Remember, the Q1 GDP report surprisingly missed estimates when it was initially released in April, while Friday’s PCE report is the Fed’s preferred inflation gauge.
On the earnings front, we have a few notable names in retail and tech reporting this week.
Some of the interesting retailers include: Abercrombie & Fitch, Chewy, Dick’s Sporting Goods, Kohl’s, Costco, and Best Buy.
Some of the interesting tech earnings include: Box, Salesforce, C3.ai, Okta, Dell, Zscaler, Marvell, and MongoDB.
Market Indexes and Winners
Good Stock Set Ups
STOCK SETUP: SA @05/28/2024
| Ticker | SA, Seabridge Gold, Inc. | Note |
| Last Price | 15.88 | |
| Buy | 15.88 | Limit Order This is generated by our mechanical trading system. Please read the chart section for more detailed and flexible entry options. |
| Target | 17.47 | Default at 10%, Or Sell when close below ma5(short term)/10(midterm)/20(long term) or when big down day or when formed inverted hammer at a resistance level |
| Stop | 14.46 | |
| Reward/Risk | 1.12 : 1 |
Above is the summary of one of our Stocks Buy Setup.
More Technical Status for SA @05/28/2024
| ATR (14) | 0.59 | Stop can be set at 1xATR below recent low |
| Beta | 1.12 | Beta measure of a stock’s volatility in relation to SP500. Greater than 1.0 means more risky than SP500 |
| RSI(14) | 58.26 | Greater than 50 means bullish. Crossing above 30 in correction is a good buydip too |
| SMA20 | 5.34% | Distance to SMA20 |
| SMA50 | 6.06% | Distance to SMA50 |
| Recommendation | 1.00 | Analysts’ mean recommendation (1=Buy 5=Sell) |
Our system generated several buy signals today. SA is one of them. Let’s take a look at this stock’s chart (The first chart below is a live chart).
STOCK SETUP: UCO @05/28/2024
| Ticker | UCO, ProShares Ultra Bloomberg Crude Oil 2x Shares | Note |
| Last Price | 32.70 | |
| Buy | 32.70 | Limit Order This is generated by our mechanical trading system. Please read the chart section for more detailed and flexible entry options. |
| Target | 35.97 | Default at 10%, Or Sell when close below ma5(short term)/10(midterm)/20(long term) or when big down day or when formed inverted hammer at a resistance level |
| Stop | 30.31 | |
| Reward/Risk | 1.37 : 1 |
Above is the summary of one of our Stocks Buy Setup.
More Technical Status for UCO @05/28/2024
| ATR (14) | 1.03 | Stop can be set at 1xATR below recent low |
| Beta | 1.35 | Beta measure of a stock’s volatility in relation to SP500. Greater than 1.0 means more risky than SP500 |
| RSI(14) | 55.05 | Greater than 50 means bullish. Crossing above 30 in correction is a good buydip too |
| SMA20 | 3.65% | Distance to SMA20 |
| SMA50 | -0.46% | Distance to SMA50 |
| Recommendation | #RECOM# | Analysts’ mean recommendation (1=Buy 5=Sell) |
Our system generated several buy signals today. UCO is one of them. Let’s take a look at this stock’s chart (The first chart below is a live chart).
STOCK SETUP: SKX @05/28/2024
| Ticker | SKX, Skechers U S A, Inc. | Note |
| Last Price | 70.46 | |
| Buy | 70.46 | Limit Order This is generated by our mechanical trading system. Please read the chart section for more detailed and flexible entry options. |
| Target | 77.51 | Default at 10%, Or Sell when close below ma5(short term)/10(midterm)/20(long term) or when big down day or when formed inverted hammer at a resistance level |
| Stop | 66.92 | |
| Reward/Risk | 1.99 : 1 |
Above is the summary of one of our Stocks Buy Setup.
More Technical Status for SKX @05/28/2024
| ATR (14) | 1.48 | Stop can be set at 1xATR below recent low |
| Beta | 1.27 | Beta measure of a stock’s volatility in relation to SP500. Greater than 1.0 means more risky than SP500 |
| RSI(14) | 71.39 | Greater than 50 means bullish. Crossing above 30 in correction is a good buydip too |
| SMA20 | 4.36% | Distance to SMA20 |
| SMA50 | 12.78% | Distance to SMA50 |
| Recommendation | 1.67 | Analysts’ mean recommendation (1=Buy 5=Sell) |
Our system generated several buy signals today. SKX is one of them. Let’s take a look at this stock’s chart (The first chart below is a live chart).
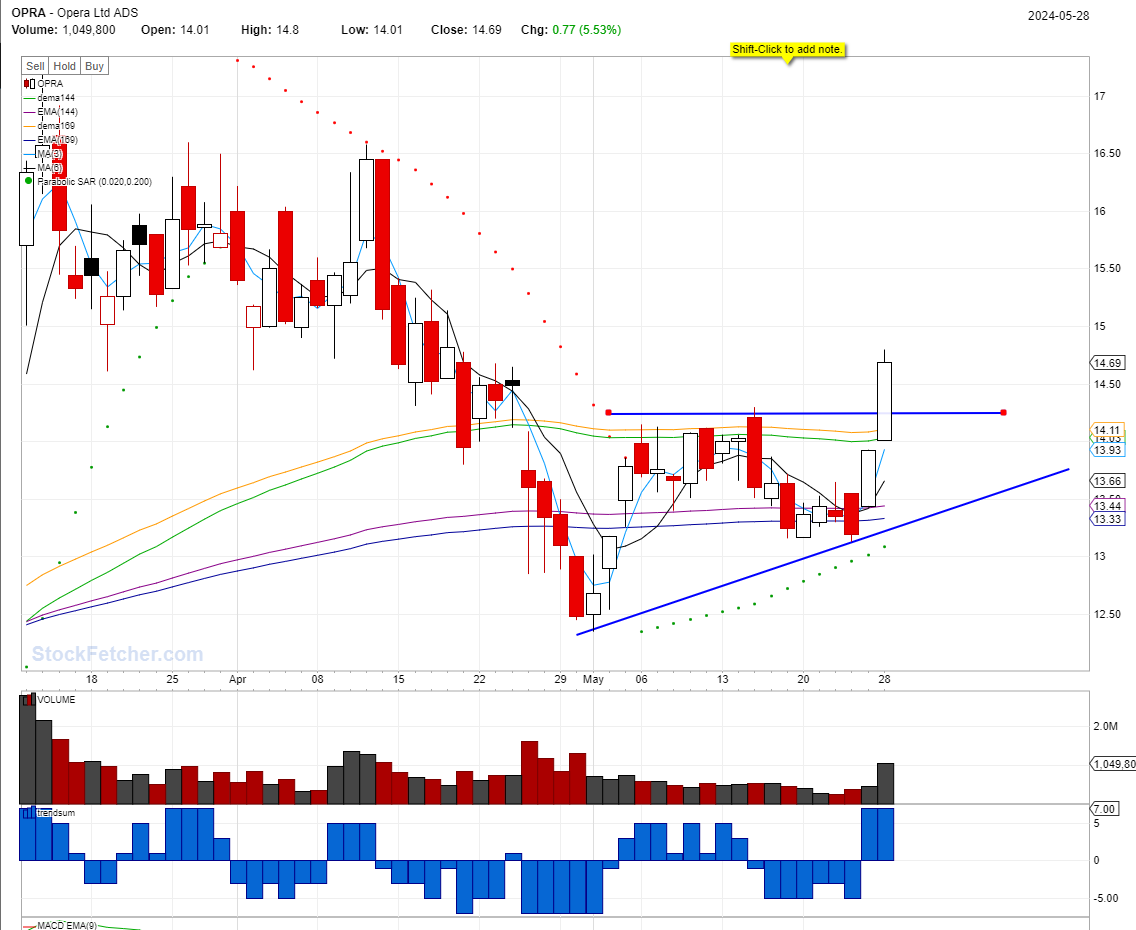
STOCK SETUP: OPRA @05/28/2024
| Ticker | OPRA, Opera Ltd ADR | Note |
| Last Price | 14.69 | |
| Buy | 14.69 | Limit Order This is generated by our mechanical trading system. Please read the chart section for more detailed and flexible entry options. |
| Target | 16.16 | Default at 10%, Or Sell when close below ma5(short term)/10(midterm)/20(long term) or when big down day or when formed inverted hammer at a resistance level |
| Stop | 13.64 | |
| Reward/Risk | 1.4 : 1 |
Above is the summary of one of our Stocks Buy Setup.
More Technical Status for OPRA @05/28/2024
| ATR (14) | 0.60 | Stop can be set at 1xATR below recent low |
| Beta | 0.92 | Beta measure of a stock’s volatility in relation to SP500. Greater than 1.0 means more risky than SP500 |
| RSI(14) | 59.73 | Greater than 50 means bullish. Crossing above 30 in correction is a good buydip too |
| SMA20 | 8.82% | Distance to SMA20 |
| SMA50 | 1.51% | Distance to SMA50 |
| Recommendation | 1.00 | Analysts’ mean recommendation (1=Buy 5=Sell) |
Our system generated several buy signals today. OPRA is one of them. Let’s take a look at this stock’s chart (The first chart below is a live chart).
STOCK SETUP: VNOM @05/28/2024
| Ticker | VNOM, Viper Energy Inc | Note |
| Last Price | 38.73 | |
| Buy | 38.73 | Limit Order This is generated by our mechanical trading system. Please read the chart section for more detailed and flexible entry options. |
| Target | 42.6 | Default at 10%, Or Sell when close below ma5(short term)/10(midterm)/20(long term) or when big down day or when formed inverted hammer at a resistance level |
| Stop | 37.06 | |
| Reward/Risk | 2.32 : 1 |
Above is the summary of one of our Stocks Buy Setup.
More Technical Status for VNOM @05/28/2024
| ATR (14) | 0.79 | Stop can be set at 1xATR below recent low |
| Beta | 1.74 | Beta measure of a stock’s volatility in relation to SP500. Greater than 1.0 means more risky than SP500 |
| RSI(14) | 59.66 | Greater than 50 means bullish. Crossing above 30 in correction is a good buydip too |
| SMA20 | 3.37% | Distance to SMA20 |
| SMA50 | 1.85% | Distance to SMA50 |
| Recommendation | 1.50 | Analysts’ mean recommendation (1=Buy 5=Sell) |
Our system generated several buy signals today. VNOM is one of them. Let’s take a look at this stock’s chart (The first chart below is a live chart).